SQL · BigQuery · Power BI · Customer analytics
Customer Sales & Retention Analysis
An analysis of customer purchasing behaviour, retention and revenue using SQL and BigQuery, with insights delivered through an interactive dashboard.
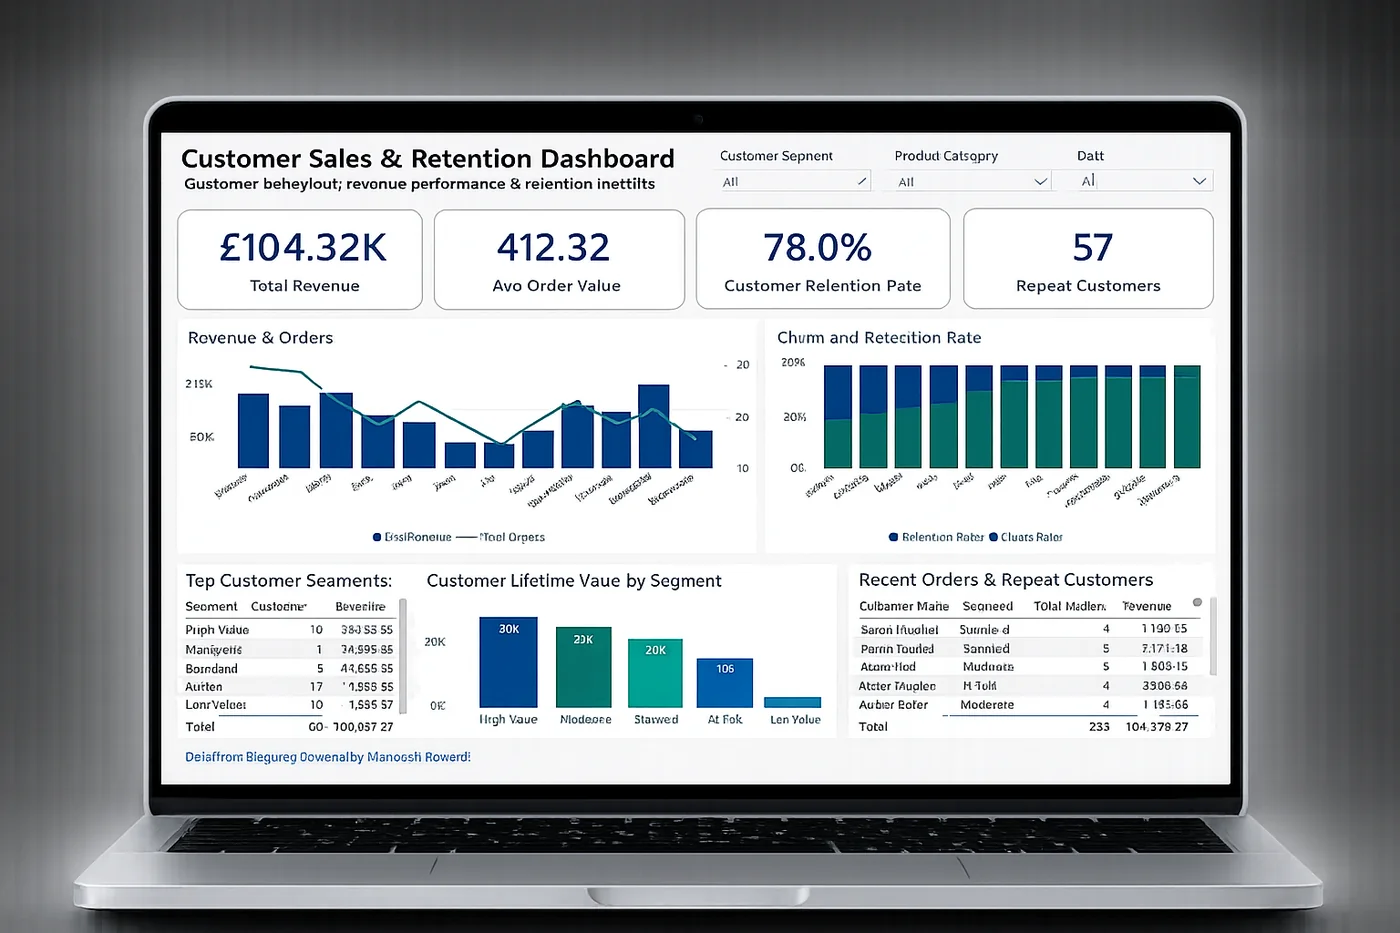
Overview
This project analyses customer sales and retention to uncover patterns in purchasing behaviour, customer lifetime value and churn risk.
SQL transformations in BigQuery feed an interactive Power BI dashboard that shows how customers engage over time and where the growth and retention opportunities are.
The problem
Businesses often struggle to see which customers drive the most value, spot early signs of churn, track repeat purchases and connect transactions to meaningful insight.
Without structured analysis, it is hard to improve marketing and long-term customer relationships.
The solution
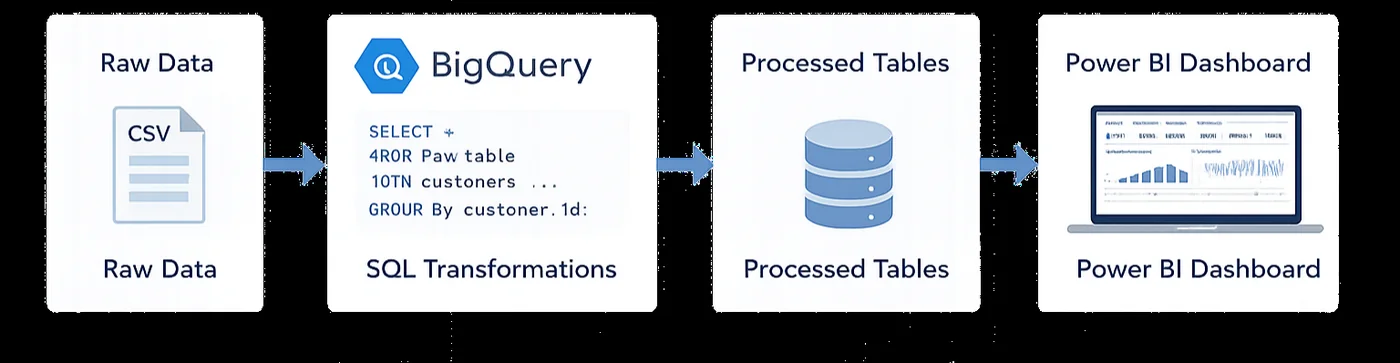
An end-to-end workflow that turns raw transaction data into actionable insight.
SQL processing in BigQuery feeds an interactive dashboard that tracks customer behaviour, revenue and retention.
Key features
- Customer segmentation by behaviour and value
- Revenue tracking and performance trends
- Retention and repeat purchase analysis
- Cohort-based customer insights
- Filters by customer group, time period and product
Key insights
- The dashboard reports £104.32K in total transaction value, an average order value of £412.32, 57 repeat customers and an average monthly retention rate of 78.0%
- A small share of customers drives a large share of revenue
- Repeat customers contribute more consistently to long-term growth
- Some segments show early signs of churn after their first purchase
- Retention varies significantly across customer groups
Technical approach
SQL in BigQuery cleaned, joined and transformed the customer, order and product data into analysis-ready tables.
Revenue, recency, order frequency and repeat-purchase metrics were calculated, with customer-level and cohort summaries.
In Power BI, the data model, DAX measures (revenue, average order value, retention, churn and repeat customers) and filters for segment, product category and date were built.
- SQL
- Google BigQuery
- Power BI
- DAX
Data pipeline
SQL example
SELECT
  customer_id,
  COUNT(order_id)  AS total_orders,
  SUM(order_value) AS total_revenue,
  MAX(order_date)  AS last_purchase_date
FROM orders
GROUP BY customer_id;