Employee training analytics · Performance tracking · Operational insights
Learning & Development Dashboard
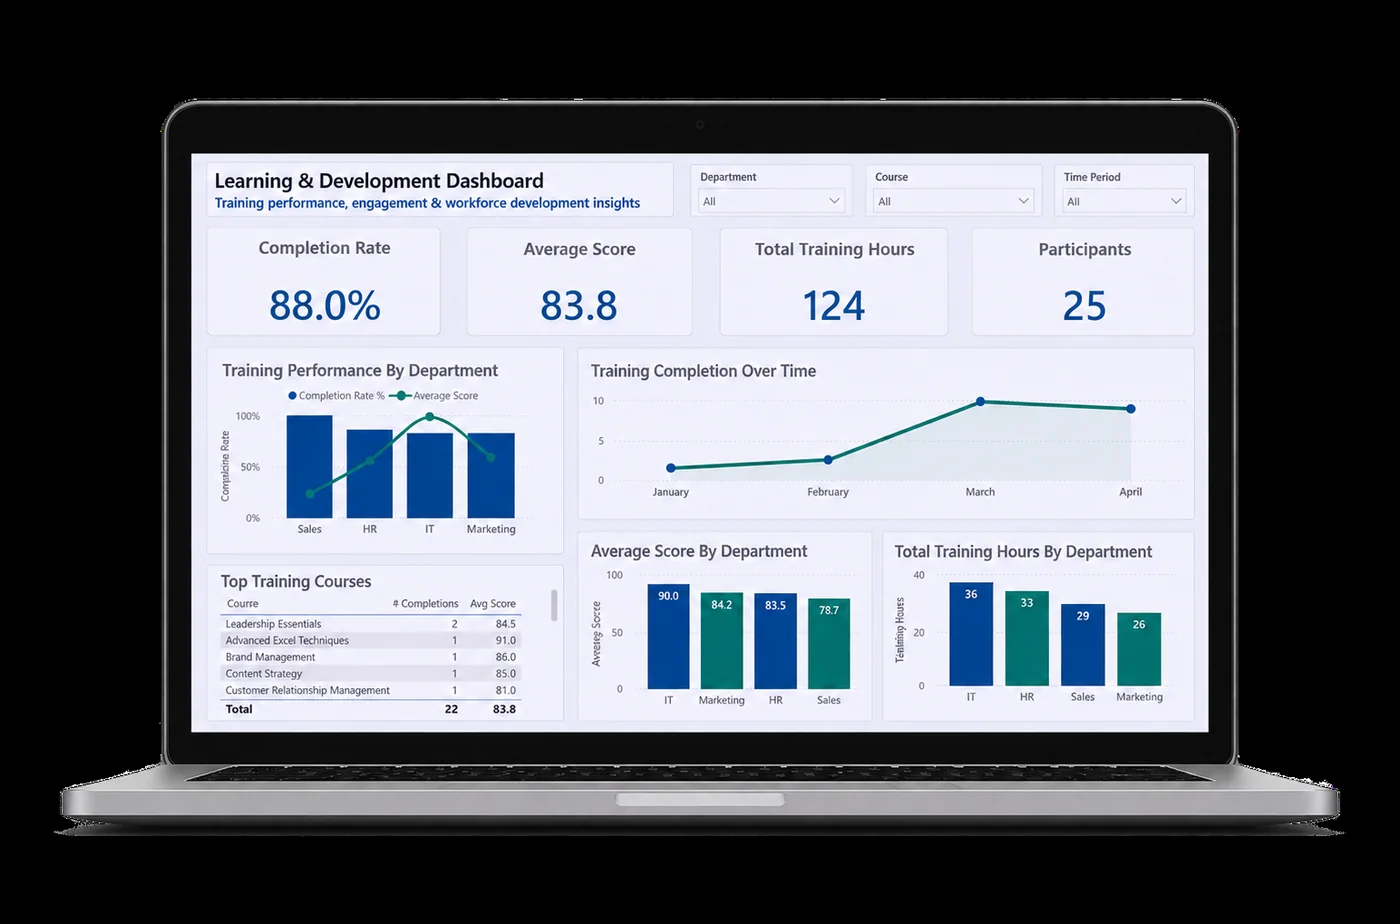
A live dashboard that tracks training performance, completion rates and employee engagement across departments.
Overview
This project improves visibility of employee training and development through an interactive dashboard.
Organisations can track completion rates, monitor engagement and find gaps in learning support.
The problem
Training data is often scattered across systems, which makes it hard to track performance and measure the impact of learning.
Without clear reporting, organisations struggle to spot engagement trends, monitor completion and judge whether training works.
The solution
A dashboard that brings training data together and gives clear insight into learning performance.
Users can monitor progress, spot trends and improve training outcomes with filters and dynamic visuals.
Key features
- Completion rate and engagement tracking
- Department and course-level analysis
- Filters by department, course and timeframe
- KPI summaries for performance monitoring
Key insights
- Training completion rates vary significantly across departments
- Some courses show lower engagement and completion
- High-performing teams participate more consistently
- The dashboard shows where training delivery can improve
Technical approach
Data was cleaned, structured and transformed so training metrics are tracked accurately.
Relationships between employees, courses and results allow dynamic filtering and reporting.
The layout puts usability and clear, actionable insight first.
- Power BI
- Excel
- Power Query
- DAX
- Data modelling