Power BI dashboard · Data analysis · Financial insights
Market Trends & Performance Dashboard
A dashboard exploring how global stock markets and commodities relate to each other and respond to economic events.
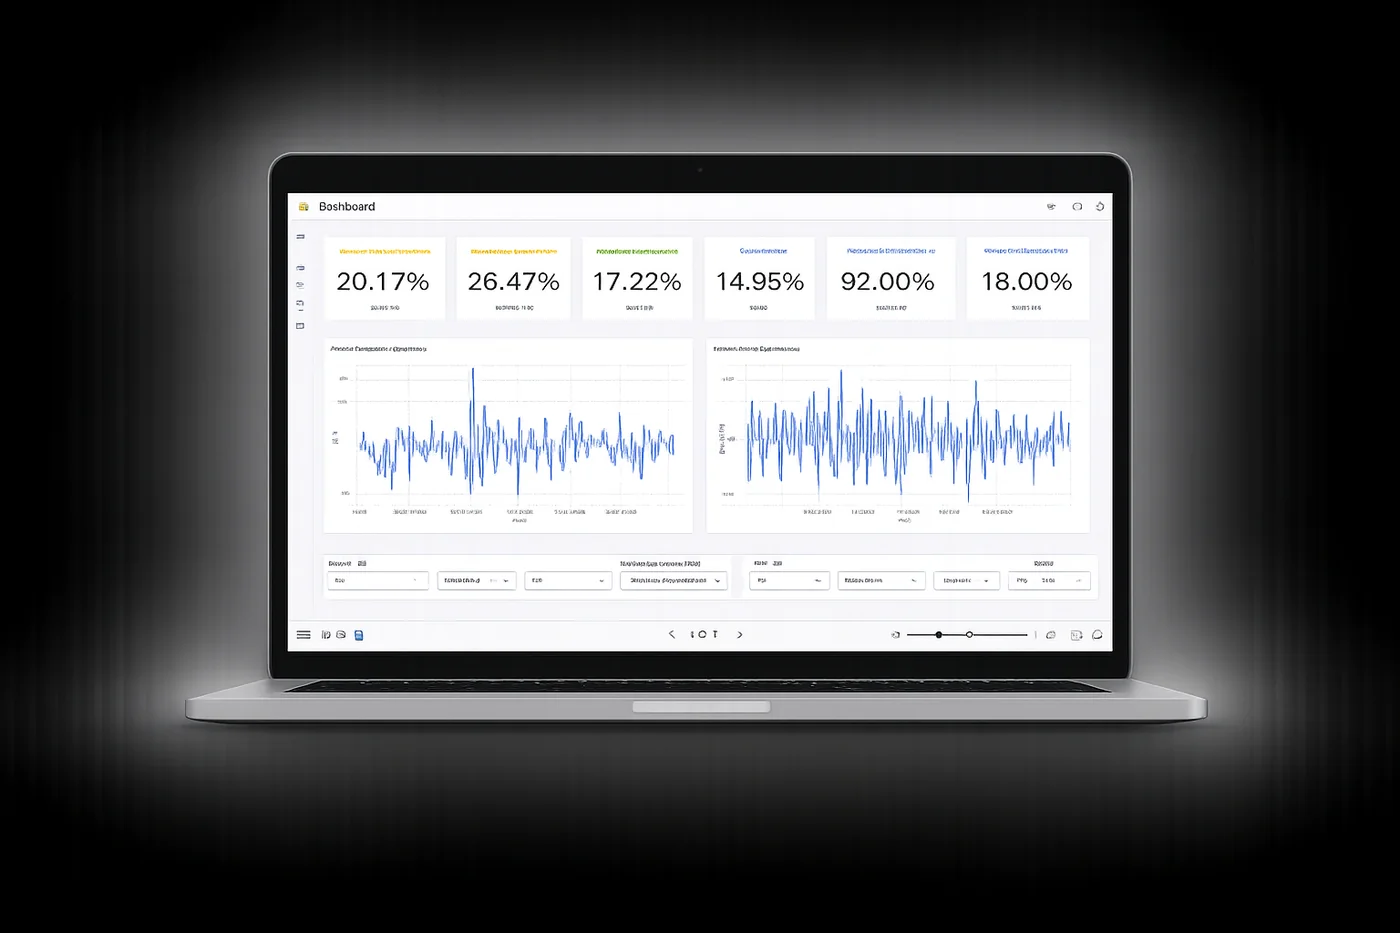
Overview
This project explores the relationship between global stock markets and commodities using interactive data visualisation.
The dashboard lets users identify trends, compare performance and understand how different assets respond to market conditions and economic events.
The problem
Financial data is complex and often fragmented, which makes it hard to see how markets and commodities relate.
Without clear visualisation, finding trends, volatility and correlations takes slow manual analysis.
The solution
An interactive Power BI dashboard that brings stock and commodity data into one easy-to-use view.
Users can explore trends, spot correlations and understand market behaviour.
Key features
- Interactive Power BI dashboard
- Cross-market performance tracking
- Correlation and volatility analysis
- Filters by region, asset type and timeframe
Key insights
- Market relationships vary across regions and asset types
- Energy commodities show high volatility and a strong influence on markets
- Gold holds steady during periods of market uncertainty
- Clear correlation patterns exist between major global markets
Technical approach
Data was cleaned, transformed and analysed using Python and Google BigQuery, then visualised in Power BI.
- Power BI
- Python
- Google BigQuery
- Excel